Blog· October 8, 2026
Reading attachment counts as a leading indicator of brand growth
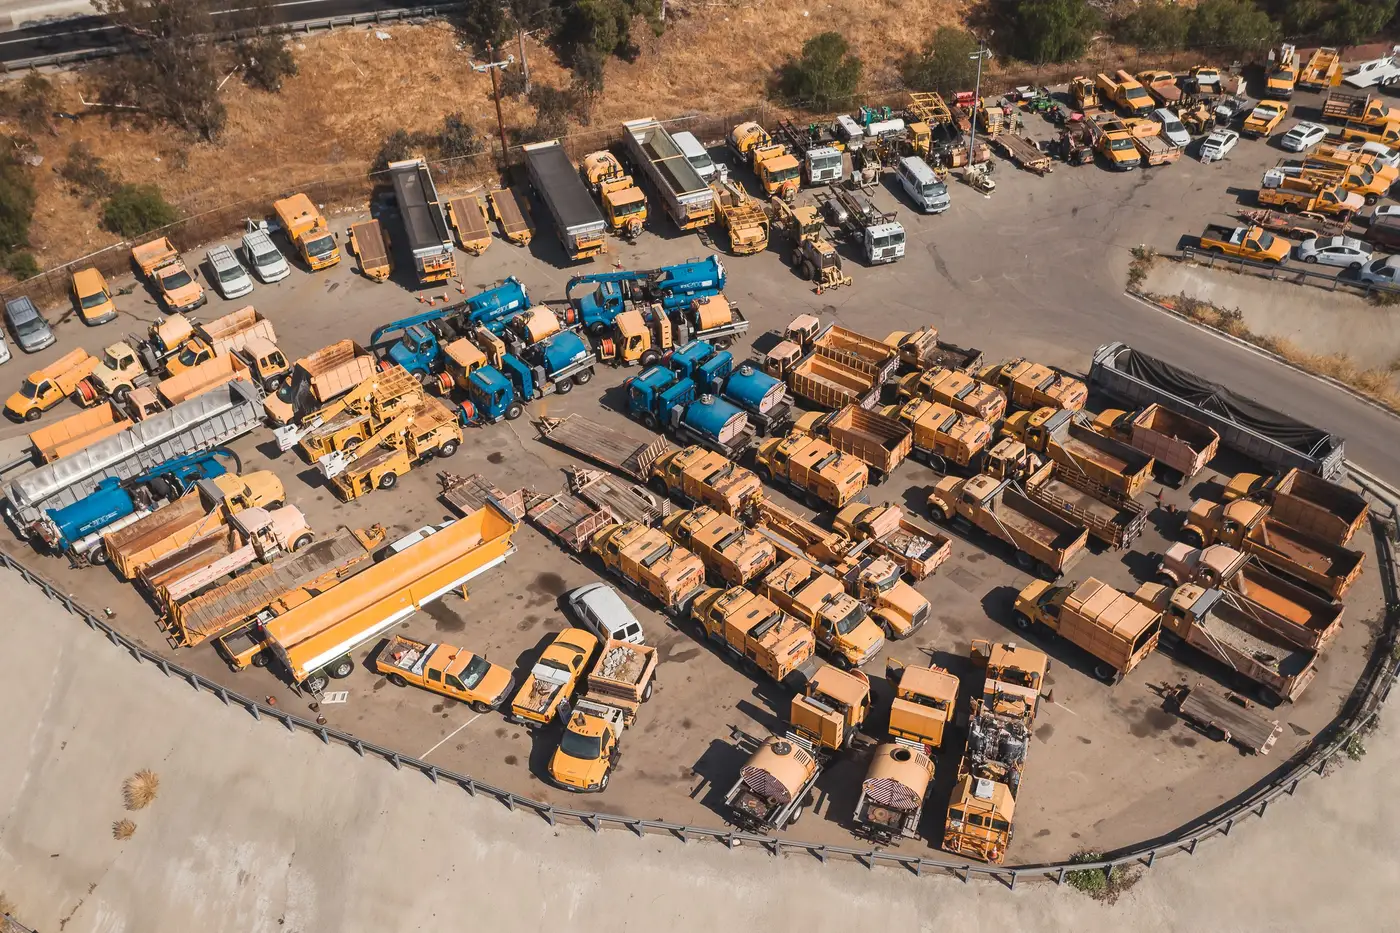
A rep drives past a gate, counts five yellow machines, and calls it a win for the home team. But the machine count is a lagging number. A fleet turns over slow. What turns over faster is what's bolted to the quick coupler.
Why attachments move first
When a contractor tests a new brand at a site, they rarely swap the whole fleet in one pass. They buy a loader or two, leave the rest of the fleet as-is, and start cycling attachments across whatever iron is already on the ground. A grapple bucket, a set of forks, a brush cutter carrying a different brand's name than the carrier underneath it. That mismatch, a brand's attachment riding a competitor's machine, is often the first physical evidence an account is shopping around before a single additional machine ever shows up.
So the number that moves first measures how many attachment brands are stacked against how many carrier brands on the same yard. Track that ratio over a few quarters and you're watching a decision get made in real time, not reading about it after the fact in a dealer's win report.
Attachments vs. machine counts: what each one tells you
Machine count answers one question: who currently owns the fleet. It's the lagging half of the picture, useful for a scorecard but slow to move because equipment life cycles run years, not months.
Attachment count answers a different question: who's being tried out or phased in. Attachments cost less than a carrier, rotate in and out of a yard faster, and show up ahead of a full machine order. A buyer running one brand's grapple on a rented loader is a buyer close to ordering that brand's loader outright.
Put the two together and a sequence shows up: attachment brand changes first, machine brand follows a quarter or two later, sometimes more. Reading attachment mix on its own tells you less than reading it against the machine count parked next to it on the same yard, same week.
Implementing counts as a fleet signal
Most of this starts with a rep noticing something that nobody writes down anywhere searchable. Someone drives the gate, sees three unfamiliar buckets stacked against the fence, mentions it at the next sales meeting, and the note disappears into a CRM field nobody searches again. That's one data point sitting in someone's memory, gone by the next quarter's sales meeting.
Turning it into a signal means the same yard gets read the same way, on the same cadence, account after account: what's parked, what's attached, which brand each piece carries, repeated on a schedule instead of whenever someone happens to drive by. One quarter's attachment count tells you what's there right now. Three or four quarters lined up against the machine count for the same site tell you whether a brand's foothold is growing, holding, or getting pushed out, and it tells you before the purchase order confirms it.
What a single drive-by can't give you
A single pass at a gate gives a snapshot. It can't tell you whether those three unfamiliar attachments are new this quarter or have been sitting there since last year. It can't separate a brand gaining ground from a brand that landed one sale eighteen months ago and never followed up. Only a repeated read, same site, same interval, turns a count into a trend.
That's the piece most competitive-intel reps are missing: a repeatable read of the same accounts, quarter after quarter, counting both the carriers and what's bolted to them. Share of Yard builds that read, tracking brand mix at named sites over time instead of relying on a drive-by.
If you're trying to catch a brand's share gain at an account before the machine order lands, start by watching what's on the quick coupler.