Blog· November 9, 2026
How to read equipment brand mix from satellite imagery without a site visit
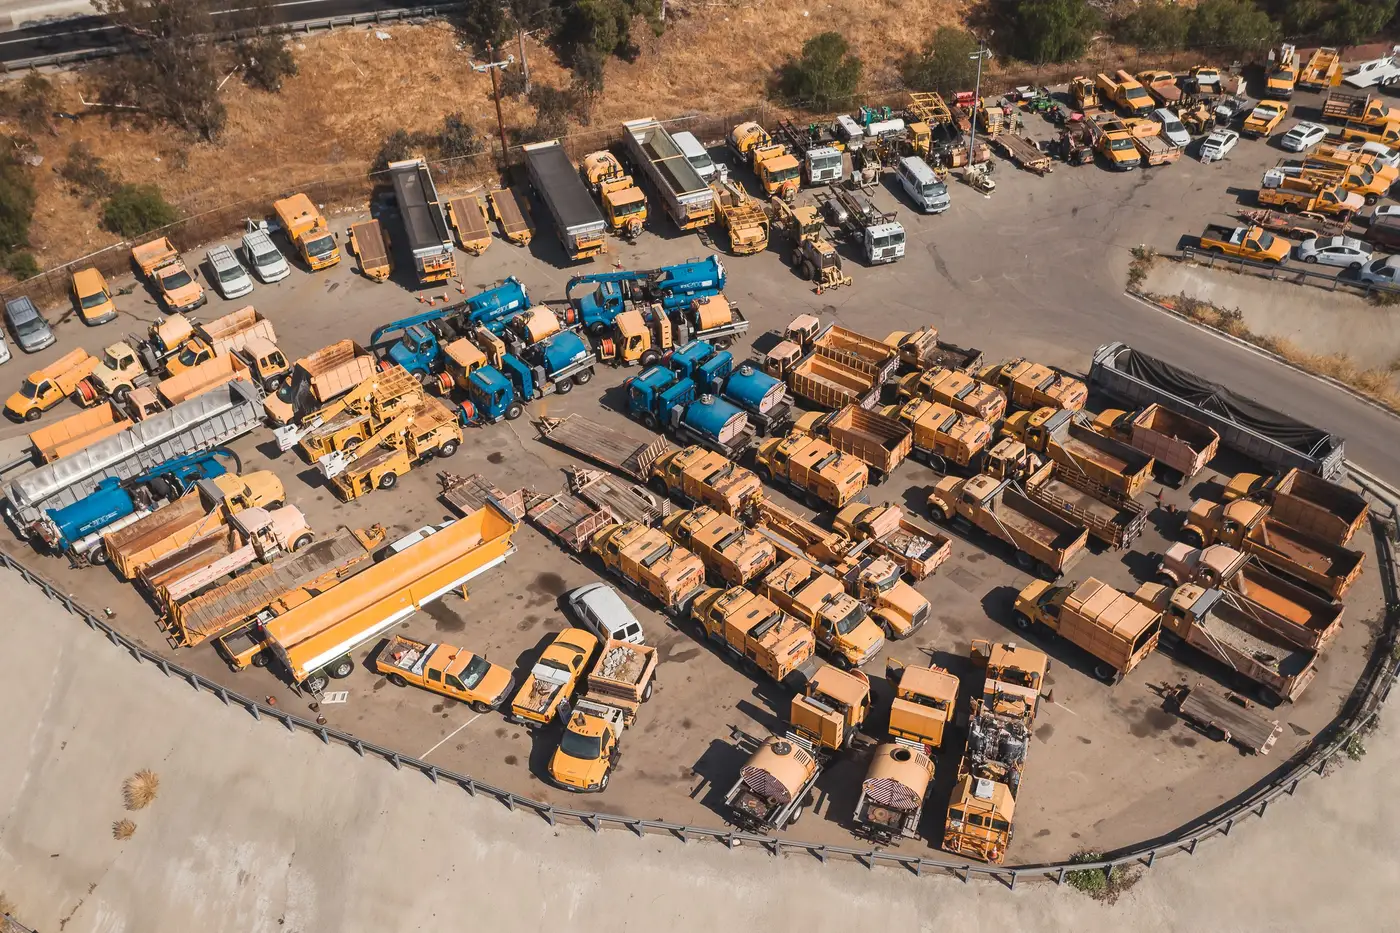
A rep driving past a dealer yard gets one look, from one angle, at whatever happens to be parked near the fence line that afternoon. Half the lot might be behind a building. The good stuff might be in the back forty where nobody parks it for show. That's the problem with eyeballing brand mix from the road: you're reading a sliver, and you're reading it once.
Imagery changes the math. With a clear overhead shot of the yard, you're not limited to what's visible from the shoulder. You see the whole footprint, every row, every corner, in one frame.
What reading a yard from above can tell you
Reading brand mix from satellite or aerial imagery comes down to two things: counting units, then attributing them to a brand by shape, paint, and configuration where the pixels allow it. That second part has limits worth being honest about. At coarse resolution, a combine is a blob. You need very high resolution, VHR, something at 0.3 meter ground sample distance or finer, before a wheel loader's boom geometry or a tractor's cab silhouette becomes distinguishable enough to call a brand with any confidence.
Even at that resolution, you're not reading a serial number off a decal. You're doing what a sharp-eyed analyst does standing at the fence: counting shapes, noting rough proportions, flagging what looks new on the lot versus what's been sitting there three visits running. The imagery gets you the same read a windshield survey gives you, minus the windshield, minus the drive, and covering ground a drive-by never would.
RGB is the baseline here: visible light that lets you match paint color and body shape against a lineup you already know.
Why one pass still isn't enough
A single satellite pass over a yard tells you what was parked there on one specific day. That's useful, but it's the same limitation as the drive-by, just from a better angle. Yards turn over. A big order gets delivered, a trade-in batch gets dealt with, a rental fleet rotates through. One snapshot can't tell you if what you're looking at is the new normal or a one-week blip.
Cadence closes that gap. Pull the same yard on a repeatable schedule, quarterly works well for most dealer and customer sites, and you start building something a single image can't give you: a trend line. Is a competitor's share of the lot climbing visit over visit, or did one big delivery spike it and it's already settling back down? You can't tell from image one. You can tell from image four.
This is also where brand attribution gets more reliable. A shape that's ambiguous in one frame gets confirmed when the same unit, or the same model line, shows up in the same spot three visits later. Pattern over time backs up a read that a single frame leaves as a best guess.
Making this a quarterly routine
Treat each site like an account you track over time, checking it quarter after quarter rather than pulling an image once. Pick the sites that matter to your competitive read, set a quarterly schedule, and keep the frame consistent so visit four lines up against visit one. That consistency is what turns a pile of satellite images into a count and rough brand attribution you can trend over a book of sites at once.
If you're trying to build exactly that kind of repeatable read, a per-site share reading tracked quarter after quarter is the whole idea behind what we built.
Start with one site that keeps coming up in sales reports and see what a few quarters of reads show.